The Sustainability StairClimb: Strategy
Nick Hein, 4/25/19
1. Introduction: Why have a strategy?
Earlier articles in this series have discussed sustainability in terms of the simple, low-risk, short-payback tactics with obvious benefits. However, when it comes to the bigger and more expensive opportunities you need a strategy that will guide you to the most effective ones first and help you plan how to pay for them. Currently the most common strategy is the payback calculation. This is a strictly monetary metric that says if you get your money back in a reasonable amount of time, and continue to save after that, then the project is worth it. The problem with this approach is that it may miss synergies that can come about by combining projects, and can’t adapt to changing conditions. In this article we’ll also talk about Fossil Energy (FE) reduction, and a 100% Renewable Energy (RE%) target strategy. The new metrics have the benefit that they are absolute, meaning that they don’t depend on a baseline that might change over time. As such they mark progress toward an absolute goal instead of a relative one. Here we’ll also track the traditional metrics like energy cost and payback time.
2. Metrics– To Manage you need to Measure
Before we begin, it’s important to measure energy in consistent units. Because your energy providers (electric, natural gas and oil suppliers) have developed independently they each measure energy differently. Electric bills show kilowatt-hours (kWh), therms for natural gas and gallons of gasoline for auto fuel. Since all these commodities are energy they be converted into a common measurement – we’ll use kWh since our common carrier of renewable energy will be electricity. Below is a table of the unit conversions, as well as a comparison of their current costs in kWh.
You’ve probably noticed how much cheaper natural gas and gasoline are per kWh, and wonder why we would use anything else. The first answer is that electricity is cleaner and easier to transport. The second answer is that once the electricity is generated it can be converted into heat or motion much more efficiently. An electric heat pump is 3 times as efficient as a gas furnace, and Electric Vehicle (EV) is up to four times as efficient. The rightmost column shows the effective cost of these fuels. Comparing these numbers to the levelized solar electricity cost of $.04 you can see why complete electrification with solar makes sense.
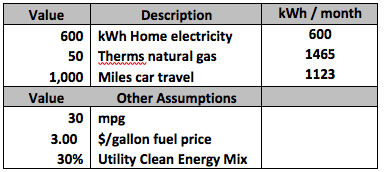
Now that we have a common unit of measure, we can calculate our current use of fossil and renewable energy (FE and RE), and how they change if we make changes to the ways we light, power and heat our homes and cars. Throughout this article I’ll be using an example of a modest home (1000 square feet of conditioned space) with average electric and natural gas use (assuming that hot water, laundry and cooking use natural gas), and a single car driven 12,000 miles per year. Here is a summary of the energy characteristics for the household.
3. Supply and Demand
As homeowners, particularly in cities, the sources of electricity that we can access are the grid (through our utility) and solar on our roof, if we choose to install it. Many utilities are taking advantage of the falling price of wind and solar generation, so already produce a substantial percentage of energy from renewables. I’ll use the example of one of the more progressive utilities that gets a 30% renewables mix. Now it’s possible to calculate the relevant metrics for our current household, and if we upgrade to a heat pump (air exchange) for HVAC and an EV using grid-supplied electricity.
Because the cost of grid electricity is so much more than the cost of the equivalent energy from natural gas, the heat pump actually increases monthly costs even though the heat is being generated with much less fossil fuel. Purchasing an EV reduces energy costs by about $50 per month, which sounds good so far. Both options reduce our fossil fuel usage and improve our renewables percentage. However, we’ve only looked at operating costs. Let’s take a look at the purchase costs of these options to get a better idea of the payback period, and what we get for our money.
In general, 5-10 years is the longest payback period most investors will accept and so clearly just upgrading appliances isn’t attractive. I’ve introduced new metrics of [$/kWh FE] and [$/%RE] to reflect the cost of improving these metrics. Although they are new and we don’t have a basis for comparison yet, it’s safe to assume there is room for improvement. This is because of the cost of grid electricity. Although we are getting some reduction in fossil fuels and a higher percentage of renewables, it’s coming at great cost. We can do better with solar.
4. Upgrading With Solar
Here are the same upgrades with rooftop solar, assuming a $7500 EV tax credit, 30% solar tax credit and 12%Focus on Energy solar rebate:
The table below shows the previous metrics, plus the amount of solar generation required for each option.
5. Conclusions
This article has shown how rooftop solar can improve the economic and environmental metrics for efficiency upgrades that would otherwise be impractical. Although the amount of PV area required to make the home 100% renewable may not be practical, conservation measures to reduce heating, lighting and other power requirements could make the home completely self-sufficient for energy if it is sited well for solar. This article has just been presented as an example for how to establish a strategy, and how to track how well you are advancing toward your goal. Future articles will offer other recommendations to make it more attainable, and the spreadsheet for doing these calculations will be made available so you can tailor the inputs to your home or business.


